In May an earlier version of the StockDashes AI rating gave my own portfolio a 5.5 out of 10. I'd let AMD drift to 45.7% of my equity — breaking my own written rule of 30% max in any single name. It reorganized data I already had without my emotional attachments: AMD as one concentrated AI compute bet, PHM and LEN as functionally one homebuilder position (r=0.88), and OXY quietly carrying the diversification of the whole book. Today the rating is one score from 0 to 100: 60% fit with the investment themes you choose, 20% diversification (concentration and correlation), 20% volatility — and it describes your portfolio without telling you what to trade.
- •A 45.7% position is a 45.7% position regardless of how strong the thesis is. In today's score, every point a single name sits above 20% of the portfolio costs 2 points of the concentration part.
- •r=0.88 between PHM and LEN makes them functionally one bet. Two tickers doesn't mean two positions — the correlation half of the score counts it.
- •AI doesn't find patterns you missed — it reads the same patterns without the stories you've been telling yourself to explain them away.
I Asked AI to Rate My Portfolio. Here’s What It Flagged — and What the 0–100 Score Measures Now
An AI rating flagged my 45.7% AMD position and two homebuilders that moved as one. Here's what it said, where I pushed back, and how StockDashes rates a portfolio today: one 0–100 score for fit with your themes, diversification and volatility.
Updated 8 October 2026: the AI rating in this story was an earlier version of the feature, which scored portfolios out of 10. StockDashes now gives one score from 0 to 100 — see the last section, “How the rating works now”.
When I opened my dashboard in May, AMD was 45.7% of my portfolio.
Almost half. One name. A position I'd been adding to since 2023 because I genuinely believe AI compute demand is a multi-year story and AMD is the cleanest non-NVDA way to play it. The thesis hasn't broken. If anything, it's gotten stronger.
But 45.7% is also a number that, written out, makes me uncomfortable. My own rule — written down, on purpose, before any of this happened — was 30% max in any single name.
I'd been finding reasons not to look at that rule.
Why I asked an AI in the first place
A bit of context: I run StockDashes, a portfolio research tool I built partly because I wanted professional-grade analysis on my own holdings. One of the features I'd shipped earlier this year was an AI rating of a whole portfolio: a score out of 10 with a written read of what you actually own.
I'd been using it on demo portfolios and other people's setups for testing. But I'd been quietly avoiding running it on my own.
The reason was obvious to me even at the time: I knew what it would say.
I held a portfolio of about 11 positions, mostly tech and AI-adjacent names. Concentrated. Thematic. The kind of portfolio that looks brilliant in a bull market and catastrophic in a sector rotation. Any analyst — human or AI — would see it and start with the obvious problem.
Eventually I sat down, hit Generate, and read the output.
What the AI said
The headline: 5.5 out of 10. "Excellent headline return, but a 45.7% single-stock weight in AMD plus multiple double-digit losers keeps this in mixed territory."
The framing was sharper than I'd have done myself. The AI didn't see my portfolio as "concentrated in tech." It saw three distinct buckets:
What you're really long: AMD as a single concentrated AI compute bet (45.7% of equity), with AMZN (18.5%) as a separate AI infrastructure position.
That sentence reorganized how I thought about my own holdings. I'd been telling myself I was diversified across AI/cloud/semis. The AI's read: I'm long AMD, with AWS as a second-order extension of the same theme, plus a scattered group of unrelated consumer-rate-sensitive names.
The correlation numbers were what really got me:
Homebuilders PHM/LEN move tightly together (r=0.88), while SOFI, CELH, ELF, and HNST are loosely tied by consumer-spending and rate sensitivity rather than a single shared thesis.
I'd been holding PHM and LEN as "two homebuilder positions." The AI showed me they're functionally one position with a label saying "two." An 0.88 correlation means they move together almost in lockstep. I wasn't diversified within homebuilders — I was doubled up.
Then the part I hadn't thought about at all:
OXY is the only position with negative average correlation to the rest of the book (-0.07) — a genuine diversifier and your sole inflation/oil hedge.
I bought OXY because I liked the setup, not because I was building an inflation hedge. The AI noticed it was doing that job anyway. One small position quietly carrying the entire diversification load of an otherwise tightly correlated tech book.
And the blind spots section was the punch:
No international or emerging-market exposure — the entire book is US-listed and US-revenue heavy.
No defensives, dividends, or fixed-income proxies — zero ballast if AI sentiment rolls over.
This is the part I'd been not-noticing. I knew the portfolio was tech-heavy. I hadn't framed it as "zero ballast if AI sentiment rolls over." That phrasing is what stuck.
Where I pushed back
I'm not a person who treats AI output as gospel. Some of it I agreed with. Some I didn't.
The thing I was prepared to push back on: the overall 5.5/10 rating. A lot of "professional" portfolio scoring systems would rate this same book higher on returns alone. The 5.5 was the AI weighting concentration risk heavily — and looking at the underlying analysis, I think that weighting is correct, but it's a choice, not an absolute truth.
The thing I had no good answer to: the AMD weight.
I'd been telling myself versions of:
- But the thesis is intact.
- But trimming a winner is a tax event.
- But I'll know when to sell.
The AI didn't argue with any of those individually. It just made me look at the number. 45.7%. Written down. Not theoretical.
What I actually did
I trimmed AMD from 45.7% to 30% over a couple of days, in two trades — not for tax reasons, but to avoid moving the market on myself.
30% was my own pre-existing rule. The AI didn't invent the number. It just refused to let me keep ignoring it.
That's the part worth naming. I'd written "max 30% in any single name" into my investment plan years ago, when I had no emotional stake in any specific position. By the time AMD was actually testing that rule, I'd built up enough conviction and enough unrealized gains that the rule felt negotiable. The AI's analysis didn't tell me anything I couldn't have figured out from my own dashboard. What it did was reorganize the same data without my emotional attachments — and put a 5.5 next to a portfolio I was telling myself was performing fine.
The proceeds went into two places: an emerging-markets ETF (the "no international exposure" blind spot the AI flagged) and increasing OXY (the diversifier the AI named as the only thing actually working in that role).
What this changed about how I think about AI for portfolio decisions
The honest answer: the AI didn't tell me anything I didn't already know.
It told me things I'd been avoiding knowing.
That's a real distinction, and it's the one I think gets lost in most "AI for investing" conversations. The pitch is usually "the AI sees patterns humans miss." For sophisticated retail investors, that's mostly wrong. We see the patterns. We see the concentration. We see the correlations. We just have stories we tell ourselves about why those patterns are fine in our specific case.
What the AI does is read the same data without the stories.
It looked at my portfolio and said, in effect: here is what you are actually long, here are the things that are actually correlated, here is what you are missing — and you wrote yourself a rule about this that you're not following.
No conviction inflation. No "but this time is different." No attachment to past decisions. No private negotiations with yourself.
The most useful AI tool isn't the one that's smarter than you. It's the one that's less attached to your decisions than you are.
How the rating works now: one score from 0 to 100
Since then the rating has changed shape. Instead of a score out of 10 with a long written read, StockDashes now gives your portfolio one score from 0 to 100, built from three parts you can check:
- Fit with your themes — 60%. You choose up to four investment themes — from a list such as AI build-out or ageing populations, or written in your own words — and AI marks every holding as benefiting from, hurt by, neutral to or mixed on each one, with a one-line reason. Weighted by what each holding is worth, a portfolio that mostly benefits from your themes scores high. The rest of the score is arithmetic on your holdings and their prices.
- Diversification — 20%. Half is concentration: every point a single holding sits above 20% of the portfolio costs 2 points. My AMD weight alone would have cost 51 of them. The other half is correlation over the past year — PHM and LEN at 0.88 is exactly what it counts.
- Volatility — 20%. How much the whole portfolio swings, from its daily returns in the currency you chose, euros or US dollars: 12% a year or less scores 100, 40% or more scores 20.
The total is labelled Weak (under 40), Mixed (40–59), Solid (60–79) or Strong (80 and up). Your real return against the S&P 500 sits next to the score, not inside it — the score is about how the portfolio is built today.
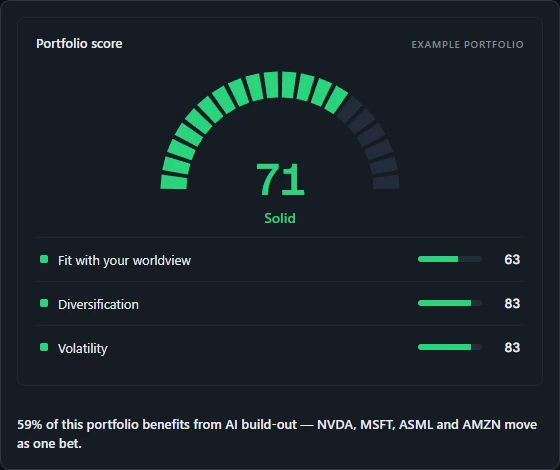
The score card today, on the fictional example portfolio from the StockDashes homepage: 71, Solid — fit 63, diversification 83, volatility 83.
Two things changed on purpose. The blind spots I got in May would now show up against the themes you chose: a theme that hurts a quarter or more of your portfolio, or one your money barely touches, is called out on the card. And the short AI summary under the score — one sentence and three points, written only from the score's inputs — describes your portfolio but never tells you what to trade. What I did with AMD was my decision; the score is there to make the numbers impossible to ignore.
If you want to see the score on your own portfolio, create an account, import your broker's export or type your holdings in, choose your themes, and read what it tells you. You probably won't like all of it. That's most of the point.
StockDashes is for informational purposes only and does not constitute financial or tax advice. The portfolio described in this post is representative and rounded for privacy; the example portfolio in the screenshot is fictional. AI-generated analysis is a tool, not a replacement for your own judgment. Always do your own research.