Nike trades at $44, but a DCF with modest assumptions pegs it at $65 and the average analyst target is $53 — so someone's wrong, and the point of building a DCF is to figure out exactly what. The post walks through four inputs (8% WACC, 3% revenue growth, 11% terminal margin, 2.25% terminal growth) chosen to reflect a turnaround that "mostly works" without heroics. The most useful move is running the model backwards: at $44, the market is pricing Nike as a business that grows near zero with margins that never recover — a turnaround that fails. That reframes the real question from "is Nike 47% undervalued?" to "do you believe management restores mid-single-digit growth and ~11% margins, or is the brand's pricing power structurally broken?" Eight straight earnings beats don't settle it, since beats against lowered bars just prove guidance management.
- •Reverse-engineer any stock price by dragging DCF sliders until fair value matches the market — that reveals the growth and margin assumptions you're actually betting against.
- •Treat terminal growth as roughly long-run GDP (here 2.25%); if a model uses 5%, it's broken, so close the tab.
- •Don't read consecutive earnings beats as proof of a turnaround — beats against lowered guidance mainly demonstrate guidance management, not restored fundamentals.
Nike at $44: The Market Is Pricing a Failed Turnaround. Should You Believe It?
A stock price is a bundle of hidden assumptions. We ran a DCF on Nike to make them visible — and what the market believes at $44 might surprise you.
Nike has beaten earnings estimates eight quarters in a row. The average analyst thinks the stock is worth $53. A plain-vanilla DCF with unheroic assumptions says $65. The market pays $44.
Somebody is wrong. The interesting part is figuring out what they're wrong about — and a DCF is the tool that makes that argument visible.
A price is a bundle of assumptions
Here's the thing most people miss about stock prices: every price is a forecast, whether anyone wrote it down or not. When the market pays $44 for Nike, it's implicitly saying something about how fast Nike will grow, how profitable it will be, and how risky that future is. The price just doesn't tell you what it's saying.
A discounted cash flow model is nothing more than that forecast, written down. You pick a handful of assumptions — how fast revenue grows, how profitable the business ends up, how much risk to charge for waiting — and the model tells you what those assumptions are worth per share today. It will not tell you what Nike is "really worth." Nobody knows that. What it does is turn a vague argument ("Nike's a buy!" / "Nike's dead money!") into a specific one: these numbers, or those numbers?
The four dials
Our Stock Research DCF has four inputs. Here's what each one means, and where we set it for Nike:
WACC — 8%. The discount rate: how much return you demand for tying your money up in something this risky. Third-party estimates for Nike cluster between roughly 7.7% and 10%; 8% sits at the friendly end of reasonable for a mega-cap consumer brand with modest debt.
Revenue CAGR — 3%. How fast sales grow over the projection window. This is the assumption doing the arguing. Nike's revenue actually shrank last fiscal year — from over $51B at the FY23 peak to about $46B — and the last four quarters have been flat. So 3% isn't a victory lap; it's "the turnaround stabilizes the business and claws back to modest growth." Bulls would use more. The recent tape argues for less.
Terminal operating margin — 11%. How profitable Nike is once the dust settles. In FY21–22, Nike converted almost 13 cents of every revenue dollar into net profit. Last year: 7 cents. Restructuring charges, discounting, a bloated wholesale channel — the turnaround exists precisely because profitability broke. Setting the terminal margin at 11% assumes the fix mostly works, without assuming Nike ever gets all the way back to its best-year economics.
Terminal growth — 2.25%. How fast the business grows forever, after the projection window. This one's the least controversial dial in any DCF — roughly long-run GDP. If you ever see a model with 5% terminal growth, close the tab.
What the model says
With those settings, the DCF lands at $65.16 per share — about 47% above the current price. The sensitivity band (±20% around base) runs from $52 to $78.
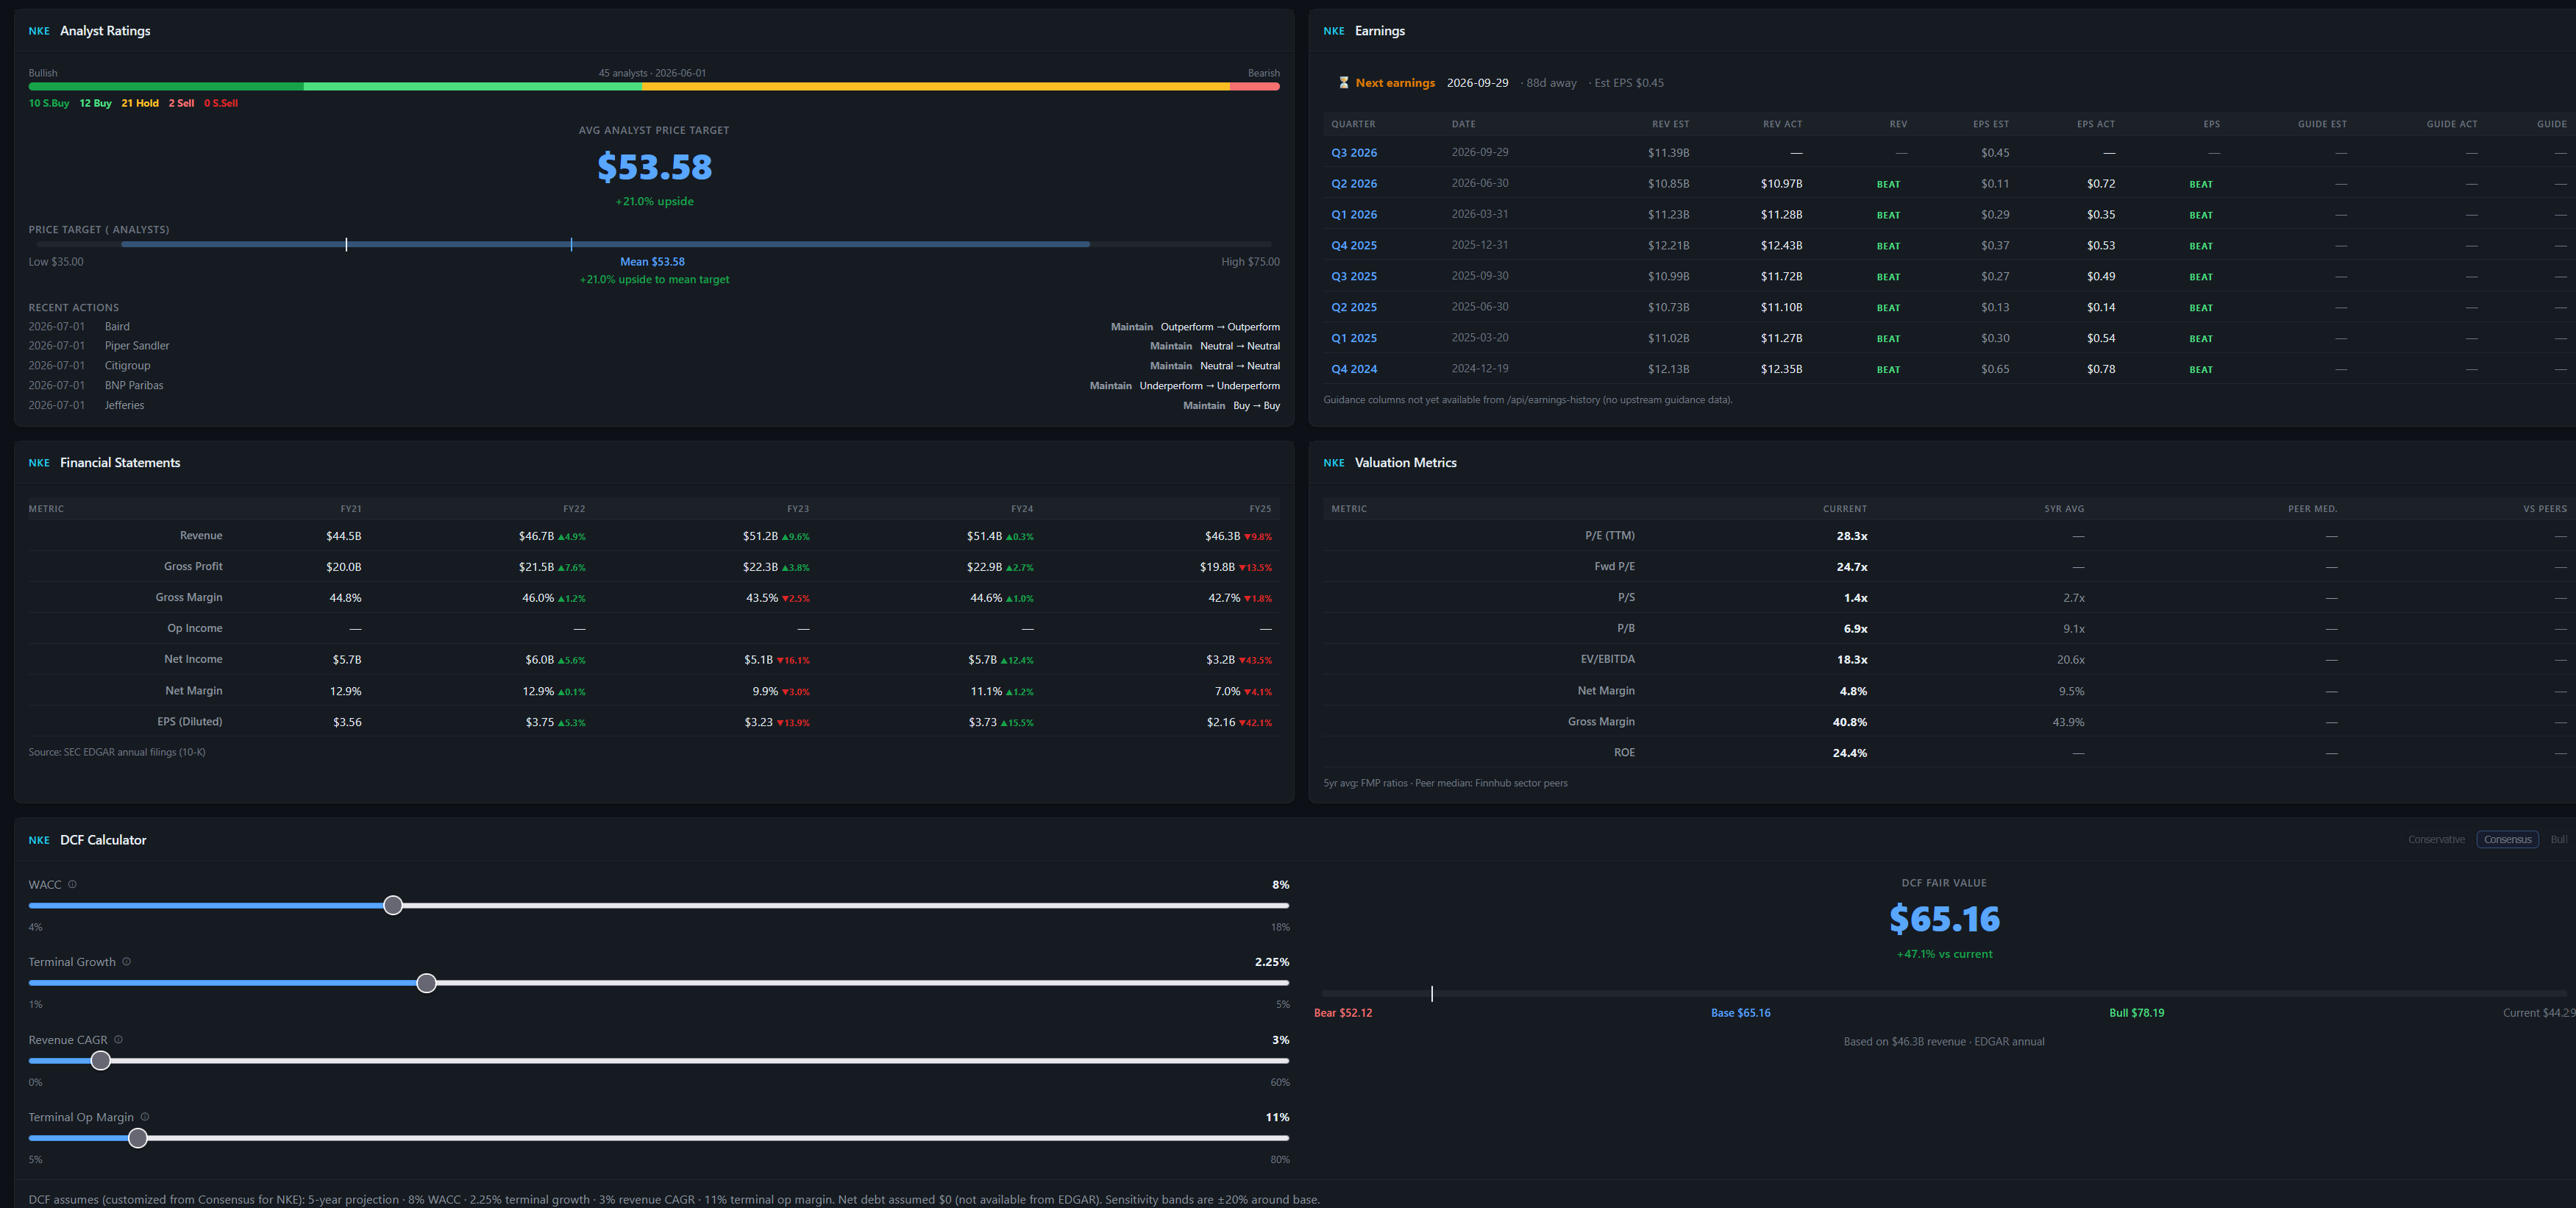
Three prices, one company:
- The market: $44.
- The street: $53.58 mean target — though the spread runs all the way from $35 to $75, which tells you the analysts are having the same argument we are.
- This DCF: $65.16.
One honesty note: that $52 "bear" number is a mechanical sensitivity band, not a true bear-case model. A real bear case — revenue flat forever, margins stuck at 8% — lands materially lower. But it's worth sitting with the fact that even the downside band of a modest-assumptions DCF sits above today's price.
Flip the model around
This is the useful move. Instead of asking "what is Nike worth?", ask: what does $44 imply?
Run the sliders backwards and the answer is roughly this: at $44, the market is pricing Nike as a business that grows close to zero from here, with margins that never meaningfully recover — a turnaround that mostly fails. Eight consecutive earnings beats haven't changed that view, because beats against lowered bars don't prove a turnaround; they prove guidance management.
So the actual investment question isn't "is Nike undervalued 47%?" It's much more concrete: do you believe new management restores mid-single-digit growth and ~11% margins, or do you believe the brand's pricing power is structurally impaired? If the first — the stock is cheap, and you now know why you think so. If the second — the stock is fairly priced or worse, and no amount of "it's Nike!" changes that.
That's the whole point of doing this exercise. The DCF didn't give us an answer. It gave us the question, stated precisely.
Run it on your own conviction
Every number in this post comes from the DCF calculator inside StockDashes' Stock Research — the sliders are live, and the fair value updates as you drag them. Take a stock you actually own, set the assumptions to what you believe, and see what your conviction is worth per share. Then drag the sliders to today's market price and meet the person on the other side of your trade. For a different way to pressure-test what you believe, here's what happened when we ran an AI over a real portfolio.
This is analysis, not investment advice. DCF outputs are only as good as their assumptions — that's the point of the article, and also the disclaimer.